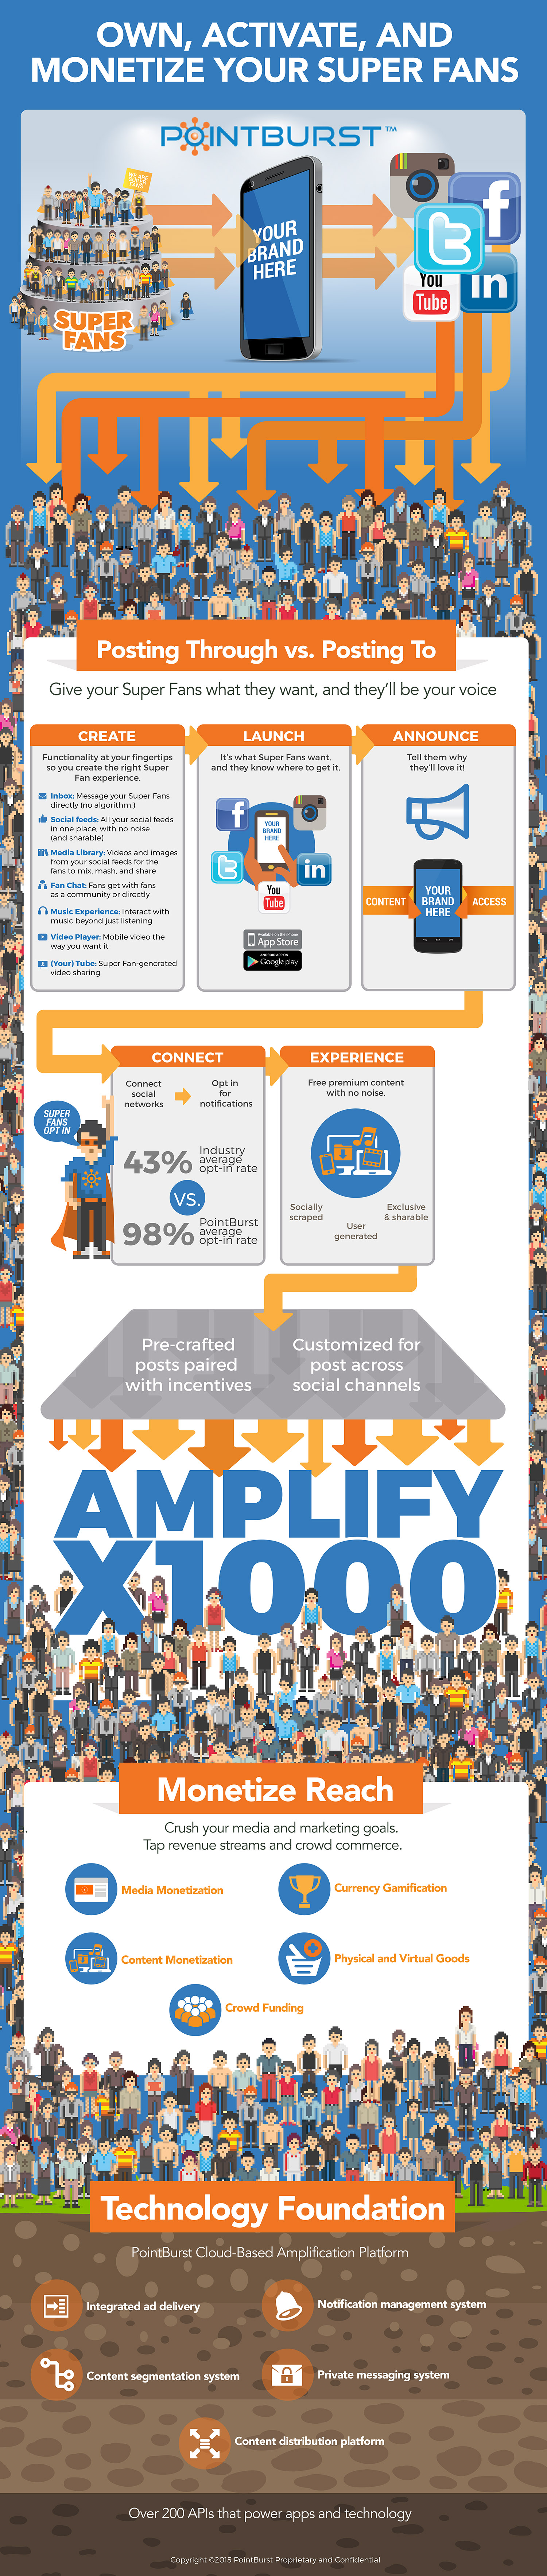
Take a ton of data points and convert it into an easy-to-understand flow of visuals. This is a very challenging and rewarding endeavor for any designer.
We always try to compare data points to something that the viewer can connect with and relate to. For example, if a data point is 18,000 computers, we relate this data to filling the AT&T Stadium, which has a capacity of 18,581 people. If you have been to the stadium and seen it, then you can imagine the magnitude of that number visually. Explore examples below of how we took a variety of data points and created clear visuals to help an audience comprehend the information.